 |
||||||||

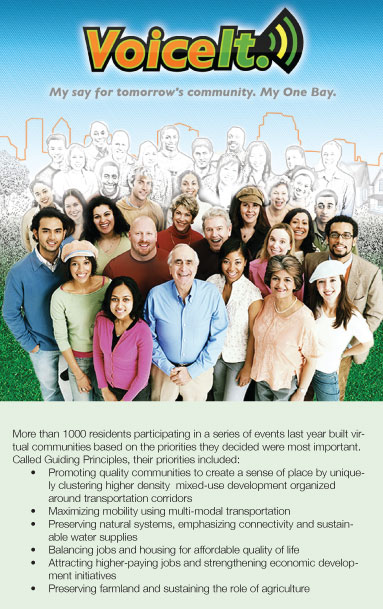
Voice It: Help Shape Tampa Bay’s Growth
 What will Tampa Bay look like in the year 2050 when the region’s population is expected to nearly double to seven million people?
To help people visualize the alternatives, a series of four distinct scenarios was created to describe where and how those residents could live, work and play. The scenarios are part of a new campaign called One Bay “VoiceIt” that offers today’s residents a chance to share their opinions on how that growth should occur.
“We can’t stop people from moving here, and we need to start planning now so that our quality of life and natural resources are protected,” notes Manny Pumariega, executive director of the Tampa Bay Regional Planning Council.
The four scenarios include:
A: Growth continues as it has over the past decade.
B: The region is developed following guidelines identified in a series of meetings where more than 1000 people from across the region used Legos to identify development patterns.
C: Compact pedestrian- and bike-friendly communities are built near transit centers to reduce the region’s dependence on automobiles.
D: New development avoids water resources and wildlife habitat.
Planning protection for water resources, including Tampa Bay, is particularly important, adds Holly Greening, director of the Tampa Bay Estuary Program. “As we look ahead to a potential doubling of population in our watersheds over the next 50 years, it will be critical that we have a long-range vision and plan for sustainability in place that will ensure the continued progress towards healthier bays and waterways.”

Please take the time to complete the Voice It survey by clicking here to download a pdf version of the survey or by going to www.myonebay.com and "Voice It Now!" |
Scenario C, for instance, envisions a region designed specifically to accommodate mass transit options that helps residents escape long commutes – and minimizes the air pollution that creates about half the nitrogen loadings to Tampa Bay. More dense communities also require less impermeable surfaces so stormwater has the opportunity to percolate back through soil and into aquifers or to move slowly through natural wetlands areas, again minimizing contaminants in the bay.
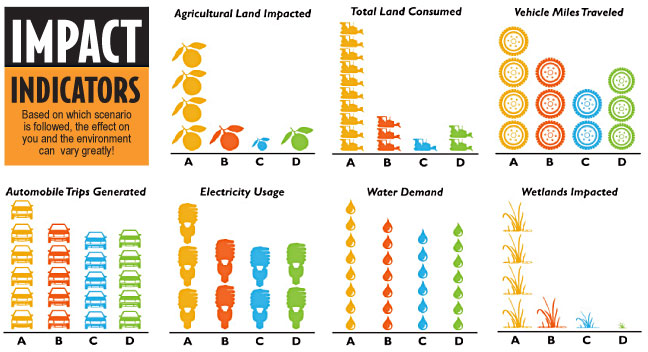
In Scenario D, planners specifically avoided construction in wetlands or in priority wildlife habitat, reducing potentially impacted lands from about 200,000 in the “business as usual” scenario to less than 500 acres.
“Even though the population growth forecast for the next 40 years continues a decades-long trend, we’ve discovered that relatively few people recognize the impact it will have on our natural resources and sense of community,” Pumariega said.
“The One Bay ‘VoiceIt’ campaign is a chance for people to decide which priorities are most important to them and to show their elected officials how they would like to see Tampa Bay continue to grow.”
While the results are not binding upon elected officials, they are expected to play a major role in local regulations, he adds.
The OneBay “VoiceIt” campaign was created by a diverse partnership of public and private leaders spearheaded by five regional organizations: Tampa Bay Regional Planning Council, Southwest Florida Water Management District, Tampa Bay Partnership’s Regional Research & Education Foundation and the Urban Land Institute Tampa Bay District. The organization was formed in 2007 to follow through on the success of Reality Check, a series of events where citizens from across the region planned the future of Tampa Bay using Legos for buildings and ribbons for roads and transit options.
“Our goal is to ensure that every resident understands that the decision we make today will drive the future – and the longer we delay in making those critical choices, the less impact they will have on how Tampa Bay looks in 2050,” Pumariega said.
 Using citizen input generated from Reality Check events across the region, the One Bay “VoiceIt” initiative created four distinct scenarios to explore the consequences of potential growth patterns for the Tampa Bay region. All four scenarios accommodate the 3.2 million new residents expected to live here in 2050, with the 1.5 million new jobs and 1.3 million new homes they’re expected to need. Based on input from people like you, we hope to create a shared vision for the future of Tampa Bay.
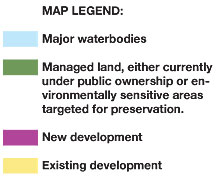
Green areas remain constant in all four scenarios. Across the board, participants in Reality Check respected the environmental value of those lands, even though some parcels have been targeted for protection rather than actually purchased or operating under a conservation easement. Other properties also have been identified as priorities for management agreements since the original overlay was created in 2005. Florida Forever, re-authorized by the Legislature this spring with a budget of $300 million annually, has been expanded to include funding to protect working ranch and timber lands as well as important habitat and natural areas. Voters in Hillsborough County will be asked to extend the popular Environmental Lands Acquisition and Preservation Program (ELAPP) this fall.
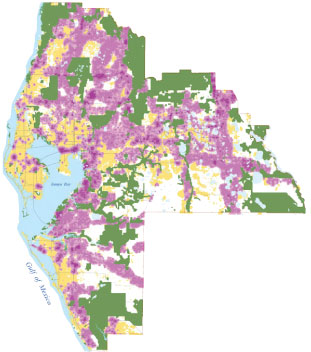
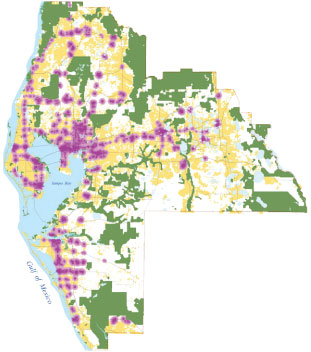
Scenario A
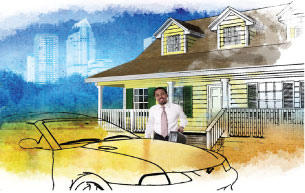 This alternative depicts how scenario builders expect Tampa Bay to look if future development follows the growth patterns and trends of the past. It’s the “business as usual” representation of how and where growth would likely occur if those patterns continue – but it is not a forecast of what will happen in the future.
The scenario anticipates the ongoing development of suburban-type communities with an average density of about two homes per acre. The edges of cities will continue to blur and grow together, creating a continuous city running from downtown cores to the outer reaches of the region, generally clustered near interstate highways and major roads.
If those trends continue, the amount of developed land will nearly double as the population grows, requiring more than 500,000 acres to house new residents and provide them with jobs. While most of that land will be converted from agricultural uses, up to 200,000 acres of wetlands and wildlife habitat may be impacted. State and local regulations call for “no net loss” of wetlands, but mitigated wetlands or those in close proximity to development may not be as effective as those left in a more natural state. The value of wildlife habitat, even if protected, also may decline if connections to other habitats are lost to development.
 The vast majority of new residential construction will be single-family homes that are built in dispersed communities requiring more automobile use.
Costs for infrastructure to serve those new communities also may be more expensive than improving services in existing neighborhoods. At the same time, a continued emphasis on new construction may mean that older neighborhoods deteriorate and become even less attractive to new residents.
Scenario A anticipates:
• Ongoing development of suburban-type communities with single-family homes.
• The amount of developed land will nearly double as the population grows, requiring more than 500,000 acres to house new residents and provide them with jobs. Up to 200,000 acres of wetlands and wildlife habitat may be impacted.
• The average commute is likely to become even longer and more expensive as homes are built farther away from employment centers.
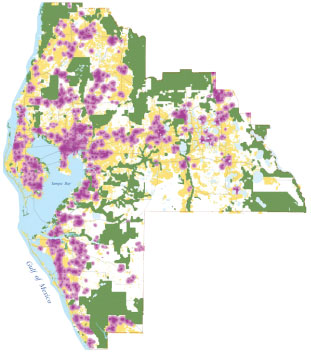
Scenario B
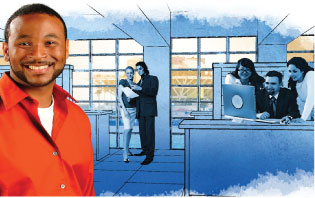 This scenario places populations and jobs in close proximity to where the more than 1000 citizens participating in Reality Check events put their Legos. It quadruples the use of revitalized properties in and near city centers when compared to Scenario A. By focusing growth in mixed-use neighborhoods with village centers, residents will have the option of accessing jobs, shopping and entertainment with a short walk or bike ride.
Nearly 40% of the new housing in this scenario is the traditional single-family home. However, more emphasis will be placed on the construction of alternatives like clustered townhomes, garden apartments, homes above retail stores in mixed-use buildings, and mid- or high-rise condominiums that take advantage of scenic views or proximity to regional activity centers.
Some of these trends already are visible in Tampa Bay. Residential construction has dominated downtown skylines in Tampa, St. Petersburg and Clearwater for the past several years, although more recent economic problems have slowed the pace of new development. Residents in these mixed-use communities have greater opportunities to live, work, attend school and do much of their shopping near home, often as pedestrians or bicyclists rather than depending upon an automobile on a daily basis.
 With an increased emphasis on mixed-use communities, the number and length of automobile trips will be reduced, although an exact number is hard to forecast. Long-term data indicates that people living in neighborhoods where jobs, schools and shopping are close by reduce their automobile use by about 20 to 25 percent, but some researchers who have focused on more recent trends in mixed-use development anticipate reductions of up to 40 percent.
Scenario B also results in significant differences in land-use patterns when compared to Scenario A:
• It quadruples the use of revitalized properties in and near city centers, preserving two-thirds more open space and agricultural land, 75% more wetlands, and 80% more priority wildlife habitat.
• It emphasizes alternative housing, with approximately 60% of new homes consisting of options like townhomes, garden apartments, homes above retail stores in mixed-use buildings, and mid- or high-rise condominiums that take advantage of waterfront views or proximity to regional activity centers.
• The number and length of automobile trips will be reduced up to 25 percent and enhanced rail and bus transit options become increasingly viable as the population density increases.
Scenario C
 The third alternative crafted by scenario builders expands upon the placement of Legos and ribbons to emphasize compact design that encourages mass transit. Sometimes called “transit-oriented development,” this scenario envisions the creation of compact, walkable communities located near transit stations to minimize dependency on automobiles.
In this scenario, new towns and communities with distinct borders would be built along the transit corridors. The clustering of development increases the viability of neighborhood-oriented business, offering both nearby jobs and shopping opportunities for residents. Along with new communities, an estimated 20,000 acres close to urban cores will be redeveloped into new walkable communities that are also likely to enhance employment opportunities.
Like the village centers envisioned in Scenario B, generous parks and outdoor recreational facilities are expected to be easily accessible to residents in these new neighborhoods, along with schools and community activity centers.
 Scenario C preserves the most open space of any of the four options. Walkable communities are often more dense than traditional development with fewer single-family homes centered on large lots and more homes on small lots and multi-family, mixed-use and townhome construction. Generally, these communities offer a greater housing diversity, a better job-housing balance and a setting that encourages people to get involved in local activities, again most often accessed by foot or bicycle.
Compact development also creates other benefits for the region:
• Of the four scenarios, this alternative is most likely to make commuter rail and other mass transit possible.
• Along with the focus on walkable communities and mass transit that minimize dependence upon automobiles, researchers forecast reduced demand for electricity and water in these neighborhoods.
• This scenario is expected to require construction of about 80% less impervious surface than would be built in Scenario A. Impervious surfaces block natural infiltration of rainwater, which limits the amount of water available to recharge underground aquifers. The volume of stormwater runoff, already the single-largest source of contaminants in Tampa Bay and its tributaries, also increases with additional impervious surfaces.
Scenario D
 Here, scenario builders combine the input of participants in Reality Check and One Bay “Voice It” with an increased focus on protecting water resources and wildlife habitat.
Tampa Bay – the body of water that unites the region – was recently recognized by the World Resources Institute as one of only two urban estuaries in the US classified as “systems in recovery.” Regional efforts over the last 40 years have actually reduced water pollution in the bay even as the region’s population boomed. Maintaining that recovery, however, will be even more difficult as the region continues to grow.
Development in this scenario will look much like that anticipated for Scenario B but with an increased emphasis on protecting lands that have environmental value. Scenario builders combined maps from state and local organizations that identified priority habitat, then overlaid them with wetlands maps.
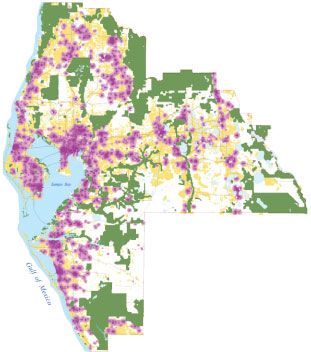 Construction in areas defined as wetlands, aquifer recharge areas and priority habitat will be avoided, even in cases where it might increase conventional sprawl. Approximately 24,000 acres are targeted for redevelopment near downtown cores, with mixed-use communities serving a diverse group of residents expected to be built. Overall density will be similar to that in Scenario B, with multiple housing options available.
Specific benefits of Scenario D will include;
• Less than 500 acres of wetlands or priority habitat will be threatened with development.
• Scenario D also anticipates the least amount of new construction in flood plains, minimizing harm to people, property and wildlife habitat.
• Changing land uses also has a significant impact on how we use other resources, like water and electricity. For instance, fewer large lawns and a more efficient use of reclaimed water mean Scenarios B, C and D are likely to achieve a 20% reduction in water use when compared to current trends. Homes in higher-density communities also create less wastewater and stormwater and use less electricity, resulting in cleaner air and water.