With multiple sources of pollutants spilling into Tampa Bay – but limited funding to address them all – it’s critical that bay managers identify the most important causes of contamination so we all get the biggest bang for our bucks.
Two researchers, one from the University of South Florida and another from Florida International University (FIU) in Miami, are taking different high-tech approaches to identify sources of nutrients and fecal coliform bacteria, both of which impair waters in Tampa Bay and its many tributaries.
One project emerged from a concept that the Ocean Conservancy proposed to a small group of private citizens and experts in Spring 2022 in St. Pete. The gist of the pitch, presented by Ocean Conservancy’s JP Brooker and Chris Robbins, was this: If we use cutting-edge science to pinpoint the sources of nutrients, we can more effectively tailor place- or policy-based interventions to reduce those nutrient sources and the harmful algal blooms they fuel. While this research is just beginning, it promises to help provide cost-effective solutions that will be even more important as the region’s population continues to grow. The “Nutrient Fingerprint Project” was born.
Nutrient Fingerprints Help Identify Culprits
Like a detective tracking a murder suspect based on his fingerprints, researchers from FIU are tracking nutrient pollution based on their unique fingerprints. The work here follows a similar study in Biscayne Bay, where Kassidy Troxell, now an assistant professor at FIU, tracked phosphorus loadings to a bay with significant seagrass losses and major fish kills every summer for three years.
“Phosphorus is monoisotopic, so you can’t just look at it and tell where it’s coming from,” she said. “But it’s just like everyone in this room—we each have a unique fingerprint that we were born with.”

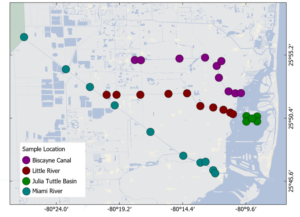
Troxell and her team began by generating a map of the Biscayne Bay watershed, including the major tributaries that feed into the bay, as well as groundwater discharges that are also known sources of phosphorus. They conducted a series of water quality tests to determine which pollutants are present over the wet and dry seasons, correlating phosphorus concentrations with different chemical traces in the major tributaries.
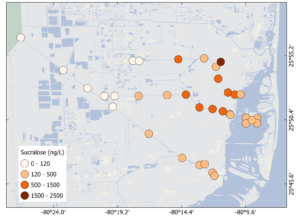
Chemical tracers captured with the water samples help identify sources based on common connections. For instance, the herbicide atrazine is restricted to licensed operators so it’s likely connected to agriculture. The chemical sweetener sucralose is connected to wastewater treatment plants because it’s connected to human consumption. On the other hand, caffeine is connected to wastewater spills or septic tanks because it breaks down quickly and probably wouldn’t survive in a water treatment facility.
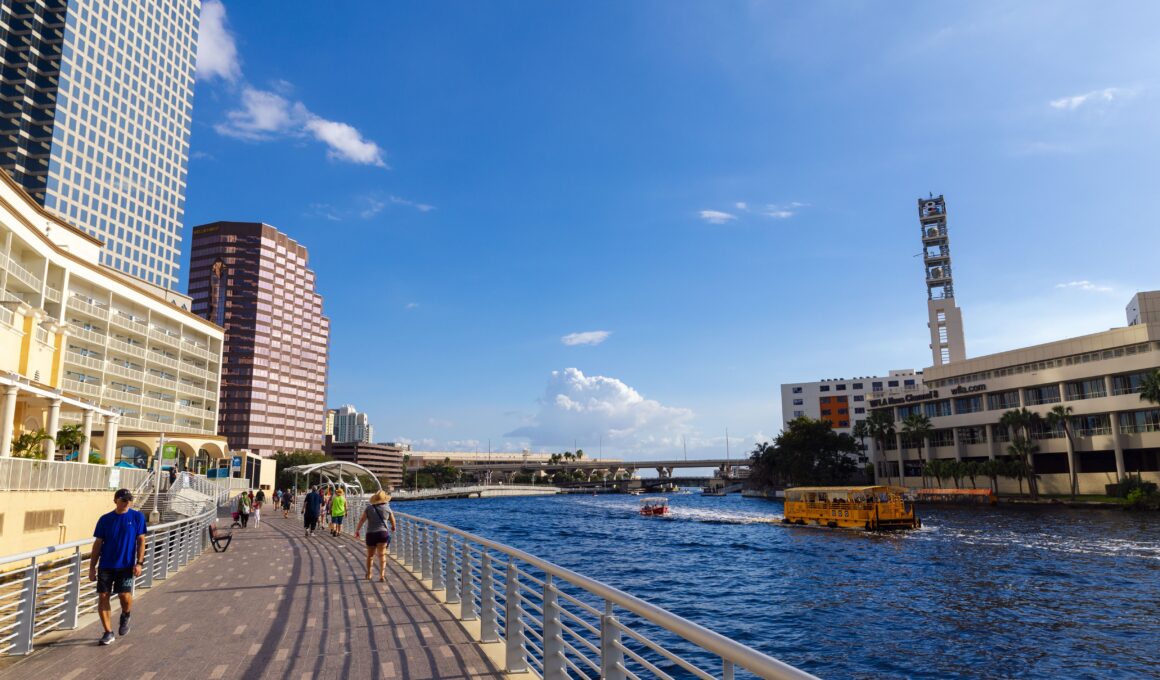
Closer to home, Troxell’s research is looking at nitrogen pollution in the Hillsborough River, which provides drinking water to the City of Tampa as it flows southwest from the Green Swamp, then meanders through urban areas and past the downtown Riverwalk.. In Tampa Bay, nitrogen is a key limiting nutrient that controls the growth of algae, so excess inputs of nitrogen can stimulate algal growth and negatively impact seagrass habitat.
Fifty years ago, 60% of nitrogen discharges in Tampa Bay could be tracked to point sources like wastewater and industrial discharges. Those sources have largely been addressed and the table has flipped: recent estimates show that 62% of the bay’s nitrogen loading comes from nonpoint sources like stormwater.
Working with Ocean Conservancy, the two-year Nutrient Fingerprint Project along the Hillsborough River is focused on controlling nonpoint source pollution by developing a tool to identify those different nitrogen sources along the waterway to a finer spatial scale than is currently available.
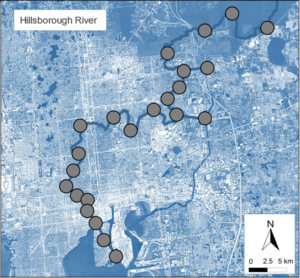
Samples were taken from 23 sites along the river before discharging into Hillsborough Bay, where more than half of its seagrasses (428 acres) were lost between 2020 and 2022. Ten sampling trips between May 2023 and February 2024 provided basic water quality parameters, and are now being processed for multiple types of nitrogen (which will aid in tracking them) along with phosphorus, and organic carbon. Hot spots for nitrogen have been identified including several bright red and orange dots near the river’s headwaters.
“Nitrogen is concentrated toward the upper part of the river and as you go downstream it starts to decrease, but then spikes again as you go through the city,” Troxell said. “We’ve done a baseline characterization and compared it to historical data, so the next phase is a deep dive into nonpoint sources and tracking them where the nitrogen is elevated.”
Sophisticated analyses of the data are underway now, specifically focusing on sources such as stormwater, septic tanks and atmospheric deposition.
Along with identifying consistent sources of pollution, the analytical processes used in this study can also be used to track contamination following emergency events. That could include discharges like the 2021 wastewater leak from the Piney Point phosphate plant which was linked to the bay’s worst red tide episode in 50 years.
The results can be processed quickly, Troxell said. “We were given water samples from scientists saw sawfish that spinning in circles and then dying in the Florida Keys. We could turn around results in a few days, and I was able to tell them there were no signs of wastewater in those samples.”
This study will provide scientists and policymakers with clear data that helps them make decisions that improve water quality, reduce harmful algal blooms and accelerate recovery of bay ecosystems, as well as to develop tools that can be used in other locations. “The long-term goal is to develop a scalable, economical process to analyze nutrient sources that can be used in other waterbodies,” Troxell said.
Originally published August 15, 2024

