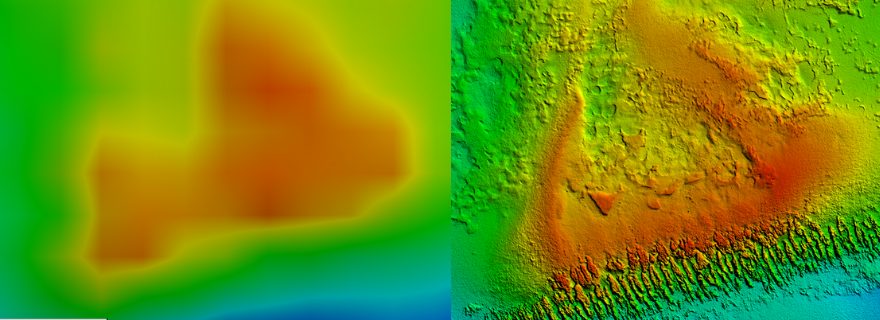
The upper left shot shows a low-resolution image of Looe Key, a reef off the Florida Keys that is one of the nation’s most popular dive locations. The upper right shows a high-resolution image that highlights the differences in elevations. Topographic images courtesy of USGS.
Divers often say that we know more about the surface of the moon that we do our own ocean floor.
Turns out, they’re right, even when they’re talking about coastal areas that most people would expect to be well-mapped, says Cheryl Hapke, chairman of the Florida Coastal Mapping Program (FCMaP) and research coastal geologist at the U.S. Geological Survey’s (USGS) St. Petersburg Coastal and Marine Science Center.
Those nautical charts that look so impressive? Some of that data dates to the 1880s when sailors dropped weighted lines into the water and marked them when they hit the bottom – also known as soundings. Most of the charts were developed using 100-meter square resolution, which would be like standing on the eighth row up at Al Lang Stadium and saying that most of the stadium’s seating and its surrounding parking areas were the same height.
It’s not just that having high-res maps is important. Coastal zones generate over $30 billion annually in revenue, including everything from fisheries and recreational opportunities to mineral resources. Underwater mapping also helps scientists refine models that determine coastal vulnerability to natural disasters. For instance, had Hurricane Michael swept ashore in Fort Lauderdale, where the continental shelf is relatively narrow rather than Mexico Beach where it extends nearly 100 miles out, the devastation would have been significantly more severe.
The first step in the decades-long process to create high-resolution maps of Florida’s coast and continental shelf started in early 2018 when stakeholder groups from across the state met to identify data gaps. The results were appalling, says Hapke, who came from California where efforts to map underwater coastlines have been underway for 10 years.
Across the state, only 18% of waters on the continental shelf have been mapped using high-resolution technology. That 18% includes Tampa Bay, although it was fully mapped in a five-year pilot study that was then the largest multi-disciplinary science project ever orchestrated by the USGS.
Off Florida’s west coast, the shelf gradually drops nearly 100 miles, then begins an abrupt descent to more than 12,000 feet at its deepest section. The shelf on the east coast is much narrower but still not significantly mapped – only about 55% of it is mapped using new technologies.
The FCMaP – composed of representatives from a “who’s who” of experts in state and federal agencies as well as the state’s universities – targeted Big Bend as their first priority. With only about 15% of the region’s continental shelf mapped, it also is one of the richest resources in the state with a rural economy that depends heavily upon its fisheries.
To determine where to start, FCMaP distributed “coins” to each of 25 stakeholder groups and asked them to place them on a grid divided into 1-kilometer sections where they could “vote” for the most important research. “It wasn’t quite as simple as that,” Hapke said. “They had to pick out the area and tell us why it was more important than other sections of the coast – fishing, geological resources, habitat mapping or architectural resources.”

As might be expected, most of the votes went to coastal sections with deeper areas getting less attention. “It still was an important exercise though, because now we know to target the areas in deeper water that got two or three votes not the ones that didn’t get any,” she said.
Even before formal mapping begins, the partnership is starting to see results. A United States Army Corps of Engineers (USACE) plane flew along the Gulf coast after Hurricane Michael to map the damage, she said. “I was part of the conversation and I asked them if they could fly over the coast of St. Marks National Wildlife Refuge with a lidar that provides 3-D maps for both land and underwater.”
St. Marks, established in 1931 to provide wintering habitat for migratory birds, includes nearly 40 miles of coast backed by 70,000 upland acres in one of the oldest refuges in the nation. That serendipitous conversation resulted in the first-ever high-resolution underwater mapping of the offshore region.
“We knew it was a karst surface, so it was marked with multiple sinkholes and probably springs that had never been identified before,” she said. “We could even see paleochannels – or channels that moved water to the ocean when the land was much higher – and wide swatches of healthy seagrasses were apparent.”
While the data is critical to the long-term success of FCMaP, part of the goal was to see what could be done with current technology already in use for other purposes, Hapke adds. “The plane flew a little offshore, so we got data in water about nine feet deep. It probably would have worked at deeper depths but the USACE goal was to get ½ kilometer of land-based data too.”
People have obviously gotten along without high-res maps for centuries, but the world is changing fast, Hapke said. Currents impacted by bathymetry influence everything from hurricanes to oil spills and Red Tide, making that knowledge critical in modeling potential damage, she said. “Particularly with Red Tide and oil spills, we’d be much more likely to know where the worst problems would be if we had high-resolution data.”
Either the enhancement or loss of fisheries – a multi-million-dollar industry in Florida – also could be impacted by improved knowledge of coastal bathymetry, said Steve Murawski, a professor at the University of South Florida who serves on the FCMaP Team. “In my opinion, you can’t underestimate the importance of habitat – where animals live is the key element in whether they persist or not.”
Knowing what’s under the sea can help protect that critical habitat from changes that may range from dredging sand for beach renourishment to building wind farms or planning appropriate sites for aquaculture.
“We need to understand the West Florida Shelf – but there’s no Google Earth for the ocean,” he says. “Florida is so important to so many fisheries and marine animals like sea turtles and dolphins that we simply must have a map.”
The next step for FCMaP will be securing funds to document the economic value of the high-res maps, Hapke said. “We’re working with a legislator now and expect to schedule a meeting with legislators who represent coastal communities in early 2019,” Hapke said.