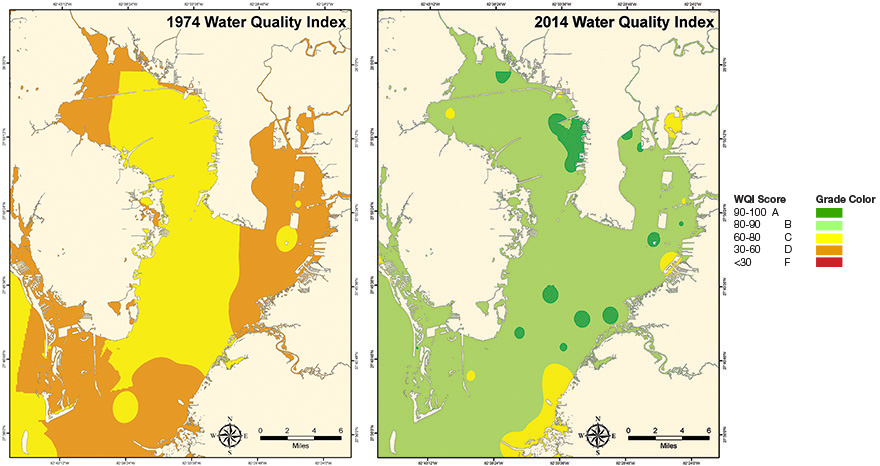
A new tracking model takes the TBEP’s familiar “Green, Yellow, Red” format a step further with more colors and enhanced graphics that highlight specific locations within the bay.
For the third straight year, all major segments of Tampa Bay met water quality goals in 2014. This marks the first time since monitoring began that water quality in all four major bay segments met targets for three consecutive years.
“Tampa Bay is one of the few urban estuaries in the world where water quality is improving even as populations continue to grow,” said Holly Greening, executive director of the Tampa Bay Estuary Program.
Good water quality is critical to recovering underwater seagrasses that are the foundation of a healthy bay. Since 1999, seagrasses have been expanding on the bay bottom at a rate of 738 acres per year.
To help track seagrass recovery, TBEP annually compares water quality to established targets in the bay and reports the results through a “Decision Matrix.” This simple report card uses a red, green and yellow color system to assess overall water quality in the bay. The rating system considers the amount of microscopic algae in the water (as indicated by chlorophyll, a plant pigment), as well as the amount of visible sunlight penetrating the water column.
The algae Pyrodinium bahamense was reported in Old Tampa Bay during summer 2014, but the blooms were not severe enough to affect the annual water quality results. Likewise, a non-harmful bloom of Neoceratium hircus algae in Hillsborough Bay in September fueled by runoff from the Alafia River did not alter overall results for this segment.
Going a step further
Water quality is monitored at 259 stations across the bay and into its watershed by the Environmental Protection Commission of Hillsborough County, which recently released a new tracking model that provides additional detail in the familiar green-yellow-red format.
Developed by Dave Karlen and Kevin Campbell at the EPCHC, the model is shaped like the bay with a wider range of colors that will help water managers hone in on specific areas of concern. It also will be updated monthly as well as annually or by the decade for a longer-term look.
“We’ve been doing so well with the decision matrix that it made sense to take a closer look at where we can make improvements,” Karlen said. “It looks at the entire database and extends the model.”
The new model also encompassed additional data for a total of seven parameters including water clarity (Secchi depth), turbidity, chlorophyll a, total nitrogen, total phosphorus, fecal coliform, and bottom dissolved oxygen. Each parameter is scored as a pass or fail. If it meets its target, it gets a point, if not then it doesn’t earn one.
The scores for the seven parameters are averaged for each sampling site and multiplied by 100 to reach a WQI score on a 0 to 100 scale. The scores for individual sites and samples are further averaged by bay segment and time period (month, year or decade) to reach an overall water quality score.
More information about the bay’s overall health will come later this year, when seagrass surveys conducted by the Southwest Florida Water Management District are released. The last surveys, covering 2010-2012, documented an increase of 3,250 acres, or more than 1,000 acres per year. The anticipated new results will cover 2013 and 2014.
The 2012 report indicated that Tampa Bay supports 34,642 acres of seagrass beds, the largest amount of seagrass measured since the 1950s. A goal of 38,000 acres bay wide was set based on the number of acres of seagrasses documented in the 1950s, minus the dredged-and-filled areas.