Modern writers might add “computer models” to that list of unbelievable forecasts – until they take a closer look at the U.S. Geological Survey’s predictions for Superstorm Sandy and its documented impact on the mid-Atlantic Coast.
As the largest hurricane ever documented threatened beaches from North Carolina to Massachusetts, USGS scientists were working closely with the National Weather Service to forecast the damage. Previous lidar measurements – using precise aerial laser technology – had created sophisticated datasets that detailed the slope of the ocean floor and the height of sand dunes along the coast. The agencies combined the geophysical data with current information on wave heights, storm surge and tides to produce up-to-date predictions that proved to be horrifically close to what actually happened.
Beaches and sand dunes were washed away, homes and roads were undercut by currents and new channels opened in areas where the barrier islands were thin. Media coverage continued for months, focusing on both the predictions of even more significant damage in future storms and ways to minimize the impact when they occur.
But Closer to Home…
Ironically, the scientists making the amazingly correct predictions were based out of St. Petersburg’s USGS Coastal and Marine Science Center. A similar model, developed without a specific storm in mind, was created in 2012 for beaches and barrier islands along the Gulf of Mexico and garnered much less attention.
“I don’t think most people understand computer modeling,” notes Hilary Stockdon, a researcher who joined USGS 15 years ago at the invitation of renowned oceanographer Abby Sallenger.
Unlike computer models for extremely complex events that do not recur on a regular basis, models for storm damage have fewer variables and happen more often so researchers can continually refine the results. “In years when we have a lot of hurricanes, we collect data,” Stockdon said. “Then in years when we don’t, we run the new data through the models.”
With more than a decade of research backing up the model, the USGS report for the Gulf of Mexico shows that 99% of the beaches bordering the Gulf of Mexico – including nearly all of Pinellas County – would be likely to experience erosion in a Category 1 hurricane. Nearly 90% of beaches are likely to be inundated in a Cat 5 storm with the beach and dune system completely and continuously submerged.
It’s always been that way, she adds. In a tropical storm, waves erode beaches but carry the sand back offshore where it’s slowly redeposited. In a stronger hurricane, sand overwashes the dunes and pushes the barrier island closer to shore. “Sand just naturally moves,” she said. “It’s only a problem when there are homes and roads in the way.”
In a worst-case scenario, water will literally cut through a barrier island. Hurricane Pass, which divided Hog Island to create Honeymoon and Caladesi islands, was created during a 1921 hurricane. John’s Pass, which separates Madeira Beach from Treasure Island, was created during the Great Gale of 1848.
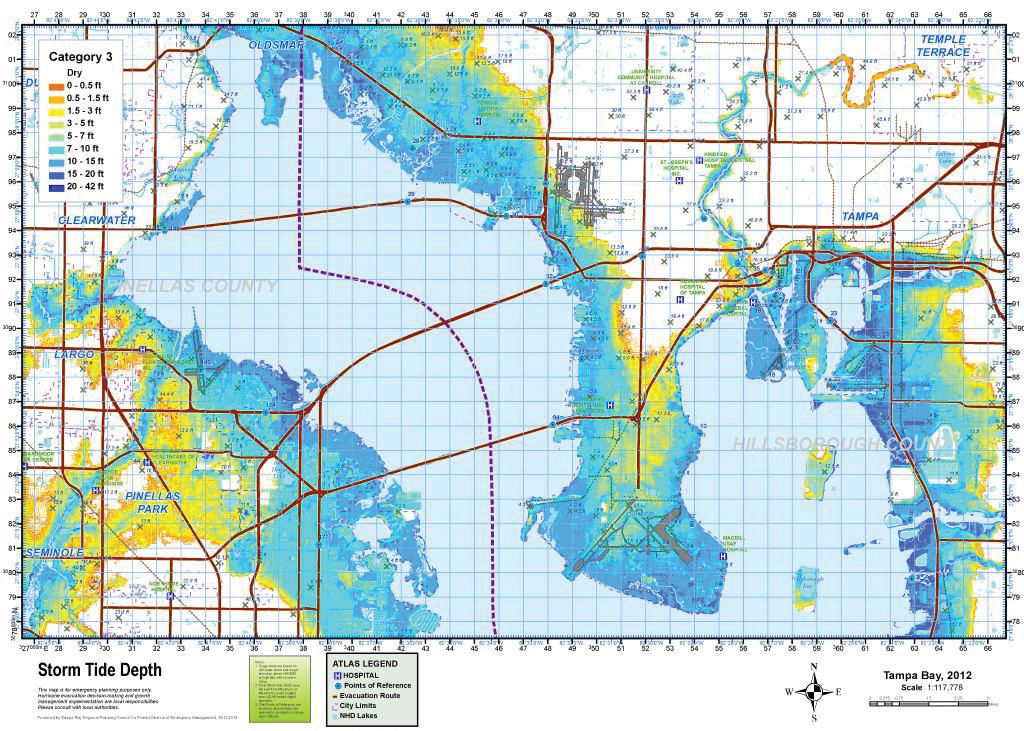
SLOSH Model Predicts Storm
Tide Flooding
While Stockdon’s work at the USGS focuses primarily on beaches, similar models have been developed for the entire region. Appropriately called SLOSH models – for Sea, Lake and Overland Surges from Hurricanes – they also are updated regularly to incorporate both more detailed topographic data, as well as the actual damage seen following a hurricane.

shows maximum surge height predicted from all modeled storms.
“The previous SLOSH models were based on an ‘average’ storm but we’ve learned that wind speed doesn’t always correlate with storm surge,” explains Betti Johnson, principal planner for emergency preparedness at the Tampa Bay Regional Planning Council. “We saw it happen with Hurricanes Katrina and Ike as well as Super Storm Sandy – the wind speeds and category of those storms did not correlate with the amount of deadly storm surge because those very large systems pushed a lot more water overland.”
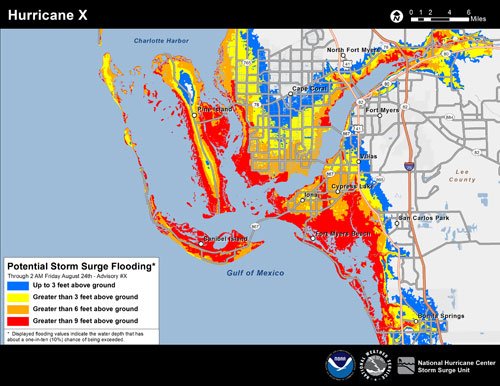
Beginning this summer, the National Weather Service will issue maps like those created for Superstorm Sandy for all hurricanes detailing potential storm surge every six hours beginning 48 hours before predicted landfall. “We’ll run 1000 variables – from wind speed and the size the eye wall to predicted movement – and come up with a realistic worst-case scenario,” said Daniel Noah, meteorologist with the National Weather Service in Ruskin.
“It’s still just a one-in-ten chance of happening but storm surge causes the biggest loss of life and damage to property,” he adds. “You’re playing ‘weather roulette’ – it may be a low probability but it has a very high impact.”
Let’s all hope that we don’t discover just how close to reality computer models in Tampa Bay really are.
[su_divider]