 |
||||||||
 |
Holistic Model Helps Researchers See Patterns in Fish Populations
By Victoria Parsons
Like chickens and eggs, scientists studying Tampa Bay are taking a new look at the old question: what comes first, the fish or the habitat?
Certainly the fish need to exist but without healthy habitat even the most ambitious hatchling program is doomed to fail. New models being developed by the Florida Fish and Wildlife Research Institute attempt to quantify the multiple and symbiotic relationships between habitat, fish and predators – including both humans and other fish.
“It’s like going from an Etch-A-Sketch with two knobs that draws lines up and down to one with 250 buttons and lines going in 200 directions,” says Luiz Barbieri, head of marine fisheries research at FWRI. “There are dimensions we can’t even visualize.”
With a traditional stock assessment, researchers look at a single species and evaluate the impact of humans on its populations. Other issues like available habitat and natural mortality are seldom incorporated into the assessment, although they may actually play a larger role in population levels.
“What we’re trying to do now is develop a more holistic, integrated approach that looks at the interconnectivity between a species, available habitat, human harvesting and natural predation and mortality,” Barbieri said.
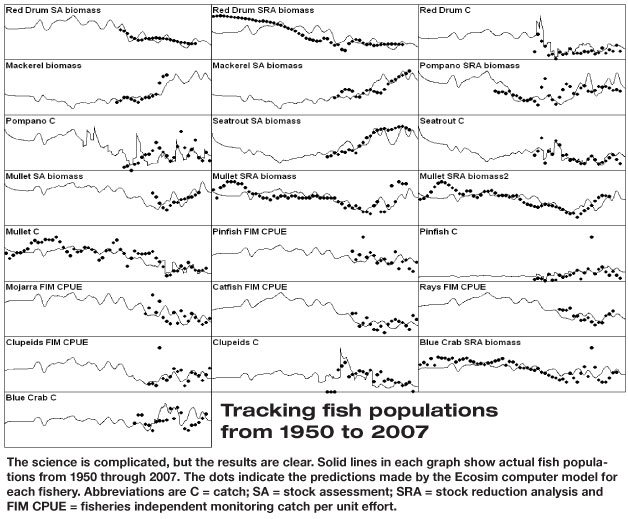
The new approach uses sophisticated software that requires intensive historic data to model the future. That helps make Tampa Bay, with stock assessment data dating back to 1950, a national leader in the newest modeling programs, notes Barbieri. “It’s a data-rich area and the availability of data over the years allows us to start to see patterns.”
The Tampa Bay data also has become the basis of a model for the coastal Gulf of Mexico that makes an unlikely policy prediction – reducing shrimp bycatch would have negative impact on several key fisheries, including red snapper. That surprised researchers because juvenile snapper are frequently captured in shrimp trawling nets and standard wisdom would have predicted that reducing the number of juveniles killed would increase the number of adult fish.
The model, called Ecopath with Ecosim, made the counterintuitive forecast by noting that populations of catfish would increase if bottom trawling was restricted – and that the catfish would actually eat more juvenile snapper than were lost as shrimp bycatch.
“It’s very hard to integrate all those factors into an Ecosim model but it does give us a different perspective and a new look at how different factors can change the dynamics of populations,” Barbieri said.
While the catfish-red snapper relationship is only a forecast, the Ecosim model does provide an explanation for the increased numbers of menhaden. That fishery grew even as commercial fishing pressure increased because populations of key predators, particularly sharks and catfish, declined. “The model points out that there are other sources of fish mortality than humans,” he notes.
And while mullet populations rebounded when gill netting was outlawed in state waters, populations of the fish that feed upon them didn’t grow substantially, adds David Chagaris, associate research scientist working on the Tampa Bay model. “Some people expected to see populations of other fish, like red drum, snook and sharks grow when more mullet was available.”
That didn’t happen, in reality or in the Ecosim model, because so many other species were available to replace mullet as prey. “It might have happened in the North Atlantic where predators and their prey are more intimately connected, but we have such a diversity of fish here that we didn’t see a very big change.”
With nearly every species tracked, Chagaris said, it’s difficult to see the differences between what the Ecosim model forecasted and reported historic data. “Everything fits, almost across the board.”
One area where the Ecosim model may fall short in the future, particularly in Tampa Bay, is recreational fishing. While daily, size and seasonal limits protect many species, at least one report indicates that more grouper die after they are caught and released than all other landings combined. At the same time, recreational fisheries are both hard to track and hard to predict, Chagaris said.
“We can estimate an increased number of trips as human populations increase, but we need better data across the board,” he said. That model may need to include economic data as well. “High gas prices could persuade some fishermen who might have gone out in the gulf to stay in the bay.”
State of the Fisheries As a coastal ecosystem surrounded by major metropolitan areas, Tampa Bay fisheries tend to be dominated by recreational anglers. Unlike reef fisheries where commercial and recreational fishermen target grouper and snapper, populations of the most popular species in Tampa Bay are stable and generally trending upward. “Inshore fisheries are in pretty good shape,” says Luiz Barbieri, head of marine fisheries research at FWRI. “I can’t think of one species that’s overfished in Tampa Bay.” With strict size slots and bag limits for recreational anglers – and limited access to commercial fishermen – the most important issues for Tampa Bay finfish are the loss of habitat and mortality rates when they’re caught and released. For instance, one study indicates that nearly 11% of the tarpon caught in Tampa Bay die within six hours after they are released. In another study, more than 40% of the total snook killed on the West Coast died after they were caught and released alive. The issue becomes more important as human populations grow and the number of fishermen increase. Habitat is another critical issue because fish have very specialized requirements that change often during their life cycles. Red drum, as an example, spawn in tidal passes and currents carry the fertilized eggs shoreward. Small juvenile fish spend several weeks feeding on invertebrates and plankton in low-salinity habitats, including marshes, mangrove wetlands and the shallow oyster beds in tidal creeks where they are protected from predators. About half of these habitats have been lost from Tampa Bay over the last 100 years. Once the fish are about an inch long, they disburse throughout the bay, living in seagrass meadows, feeding on small fish, shrimp and crabs and growing up to an inch per month. At about three or four years old, they move into gulf waters, returning to Tampa Bay primarily to spawn. Population growth in the region surrounding Tampa Bay threatens fisheries in two separate scenarios. First, withdrawing drinking water from rivers limits the extent of low-salinity habitat needed by many species of juvenile fish and crabs. Additionally, high levels of nitrogen in stormwater runoff, wastewater and industrial discharges fuel the growth of algae that chokes out seagrass beds and consumes the oxygen other species need to survive. Tampa Bay is one of the few estuaries in the nation where water quality is improving and seagrass beds are increasing, but maintaining that recovery as human populations grow will require increased efforts from both bay managers and the people who call Tampa Bay home. Future issues of Bay Soundings will highlight the creatures – large and small, well-known and newly introduced – that depend upon bay habitat to survive. |
 In Florida, dramatic stock reductions in the mid 1980s led to a 1986 moratorium on both commercial and recreational red drum fisheries. In 1989, the fishery was reopened with strict size and bag limits, as well as a no-sale provision that eliminated the state’s commercial red drum fishery.
Current Florida recreational regulations for red drum limit harvest to one per angler per day, with an 18 to 27 inch total length size limit. Nearly all red drum harvested within the slot are only 1 to 2 years old and are likely immature.
Although fishing mortality estimates have steadily increased since the 1990s, the most recent FWC model predictions indicate that red drum populations in Florida are improving and likely to soon achieve the commission’s management targets.
| In Florida, adult red drum spawn from mid-August through late November. Spawning occurs primarily near bay mouths or inlets and over nearshore continental shelf waters. The movement of juveniles into the upper reaches of the bay begins in September and continues through February. Young recruits settle at a size of approximately 1/2 inch. |
Since 1989, the FWC’s Fisheries Independent Monitoring program has been monitoring the juvenile recruitment of red drum into Tampa Bay. Each year, hundreds of samples are collected using small (70’) and large (600’) seines in Tampa Bay and adjoining tributaries such as the Alafia, Little Manatee and Manatee rivers. Researchers identify, measure, count, and release nearly half a million fish each year, including red drum, other game fishes (i.e. snook, spotted seatrout) and a variety of other local inhabitants.
These data are used to track year-class strength and trends in relative abundance, establish critical habitats, and provide additional predictive data for future adult abundance. For example, historical estimates have allowed researchers to document a significant reduction in red drum in 2005 as a result of a major red tide event. Continued monitoring in subsequent years has enabled researchers to track and detect a gradual recovery of red drum to pre-red tide levels.
In Tampa Bay, natural populations of red drum were supplemented with the release of hatchery-reared juveniles as part of Project Tampa Bay, a program designed to develop methodologies and assess the effectiveness of stock enhancement efforts. The project was implemented by a team of FWC scientists in March 2000 and continued through December 2004 with the stocking of various sized hatchery-reared red drum into low-salinity tributaries.
| Since 80 to 90% of the recreational red drum fishery is catch and release, estimates of post-release survival are critical in determining the status of the fishery. FWC scientists recently conducted a series of controlled field experiments in Tampa Bay to estimate catch and release mortality of red drum. A total of 250 red drum were used over a series of nine field experiments in Tampa Bay. FWC scientists and volunteer anglers used standard spinning tackle to collect red drum ranging in size from 10 to 29 inches. |
Since 2000, over 4.2 million fish were marked with codedwire tags and/or genetic markers and released into the Alafia and Little Manatee Rivers, two of the estuary’s most important juvenile red drum habitats. Ongoing sampling programs have been used to monitor the continued growth, survival, habitat preferences, and movement of these hatchery-reared fish. These programs include sampling in the Alafia River and adjacent waters, angler interviews by the FWC’s Fisheries Dependent Monitoring program, sonic tagging/tracking and angler fin clip return programs.
Preliminary results from Project Tampa Bay indicate that survival of hatchery-reared red drum is best in low-salinity, soft-bottom habitats, with emergent shoreline vegetation, and during the natural fall migration. Although recapture rates of hatchery-reared red drum at larger sizes (>12”) were low (<1%), monitoring results suggest that the larger fish – 6 inches or more prior to stocking – were nearly six times more likely to survive.
In recent years, FWC scientists have tagged and released thousands of wild red drum in Tampa Bay. Recapture information collected by scientists and anglers is used to estimate red drum growth, habitat preference, distributions, movement, and long-term survival.
FWC scientists have monitored the size and age structure of sub-adult red drum populations in Tampa Bay since the 1980s. Directed field studies using trammel net gear allow scientists to collect and measure hundreds of large red drum in lower Tampa Bay each year. All fish are measured for length to establish the size structure of the school and a subset of the fish are kept for further analyses in the laboratory, which include removing the otoliths to estimate age, gonad tissue for reproductive assays, fin clips for genetics, muscle tissue for mercury, various tissue and organ samples for fish health evaluations, and stomach contents for dietary analyses. Recent federal funding has also allowed a team of FWC scientists to sample schools of adult red drum from Gulf of Mexico waters outside of Tampa Bay. This study has yielded invaluable information about the size and age structure of the spawning population in the area, along with rare data on genetics, mercury, reproduction, and diet, which is being compared with earlier research.
 One of the state’s most popular gamefish, the common snook, Centropomus undecimalis, has one of the highest levels of abundance in Tampa Bay of any Florida estuary. But how is it coping with ever increasing fishing pressure? To evaluate snook stocks, scientists from state and federal agencies are combining life history parameters with fishery characteristics to determine how anglers are impacting populations.
Scientists integrate life history studies and fishery data from the Florida Fish and Wildlife Conservation Commission’s Fish and Wildlife Research Institute, angler-supplied snook carcass and logbook data, the National Marine Fisheries Service’s Marine Recreational Fishery Statistics Survey and the Everglades National Park’s recreational creel and guide surveys into age-based assessments of snook populations on Florida’s gulf coast.
Based on the latest available data from 1987 to 2004:
• Median total-harvest estimates for gulf coast snook in 2004 were higher and second only to the 1997 estimates.
• Gulf coast anglers catch and release such a large number of snook that approximately 42% of the estimated 2004 total gulf harvest died after the snook were caught and released alive.
• Interviews with anglers noting the type of fish they targeted in 2004 indicates that snook were the fourth most targeted species on the gulf coast.
• Multiple measures of effort, such as the estimated number of directed snook-fishing trips, species preference, and sales of snook stamps, confirm that fishing effort is high and increasing even though snook only occur in southern Florida.
• On the gulf coast, total-catch rates have increased since 1997 and the median standardized total-catch rate in 2004 was the highest in fourteen years. Furthermore, the fishery-independent haul seine catch rates in numbers of age 1 and 2 snook per set increased in 2003 and 2004, and the 2003 value was the highest ever recorded.
One nagging question persists, says Ron Taylor, FWRI’s top snook scientist. “What size of fish are anglers releasing?” In the last snook stock assessment (2002), sizes were assigned to released fish using two methods: the sizes anglers report catching and the sizes from fishery independent sampling. A year earlier, FWC launched a program with willing anglers to measure every fish they caught. FWC also began a fishery-independent catch-and-release fishing program in 2002 to record fish catch size. These two programs revealed sizes for more than 14,000 snook. On the the Gulf coast, 80% of the fish caught were undersized and only 2% were oversized. These average lengths were used to assign lengths for released snook to correct the imbalance in previous catch curves.
This is the second assessment since the slot-size limit was implemented in 1999. Fishing mortality on the Gulf coast was much lower after the slot limit was implemented and lower than the rates estimated in earlier assessments. In 2004, the fishing mortality for the same reference age was 0.36 per year, down from the 1997 high value of 0.72 per year. The spawning biomass of snook has continued to increase on the Gulf coast, and the abundance levels have been increasing since 1998. Still, levels for both indicators in 2004 remain below the commission’s goal.
Biologically, it is extremely difficult to separate the condition of Tampa Bay snook from snook that inhabit the entire gulf coast. What is evident is that the condition of the snook population in Tampa Bay, measured in terms of catch-per-unit-effort is at record high levels, says Taylor. Furthermore, measures of abundance, reflected in numbers of individual snook, are at all-time high levels.
Snook in Tampa Bay will always be vulnerable to reductions in absolute numbers because they are on the extreme northern edge of their distribution. That means they can be decimated by extremely cold weather. Additionally, because of their popularity and associated fishing pressure, conservation remains key to maintaining some level of surplus with which to overcome a debilitating natural calamity.
In a nutshell, says Taylor: “Limit your catch, don’t catch your limit.”
 First the good news: Blue crabs ranked first in landings of all Florida fishery species tracked by the FWC Marine Fisheries Information System in 2007, and in value, behind only spiny lobster and stone crab. In the Tampa Bay area (Hillsborough, Manatee, and Pinellas counties), 822,013 pounds of hard-shell blue crabs were landed in 2007.
Annual landings, however, can fluctuate widely and are influenced heavily by rainfall conditions, as evidenced by drought-related low landings in 2001, 2003, and again in 2007, and increased landings in wet years. Long-term monitoring using seine nets conducted by the FWRI Fishery Independent Monitoring group also shows fluctuations in juvenile and adult abundance, but those numbers generally track the long-term mean.
Beneath the surface, however, there are plenty of warning signs – some say a brewing crisis. Landings are down over the long-term average. In the short term, the ongoing drought and increasing freshwater withdrawals are robbing blue crabs of their primary habitat.
Furthermore, FWC is quick to acknowledge a critical data gap: there is no monitoring data on the recreational fishery, which managers suspect is significant. This alone could lead to a high degree of bias in these analyses, FWC says. Further muddying the water is that fact that the ages of blue crabs are not known, and there is some information to suggest that commercial discard mortality is high.
According to FWRI Researcher Anne McMillen-Jackson, bay managers have been trying unsuccessfully for years to get a handle on the recreational catch. “We simply don’t know the effort,” she says.
| Since 1965, the commercial landings of blue crab on both coasts have declined, with the lowest landings reported in 2001 (Gulf) and 2002 (Atlantic). Through 2005, landings and commercial catch rates have rebounded somewhat. Landings were about 7.4 million pounds on the Gulf coast and 4.2 million pounds on the Atlantic coast in 2005. |
Commercial crabber Gus Muench is reminded of a conversation with his wife Betsy: “I said I should have realized what was going to happen with the big economy crash. I saw young people buying new cars and houses on credit, not realizing down the road the money would dry up. Well, blue crabs are drying up because we’re destroying their base before they have a chance to spawn.” On a more positive note, McMillen-Jackson says that recently passed regulations limiting the number of fishermen in the fishery should moderate the boom and bust years, while also helping to reduce the number of derelict or abandoned crab traps that continue to kill crabs.
From where Muench sits, on a perch overlooking the Little Manatee River, the outlook is grim, unless bay managers act soon: “It just makes me sad…why doesn’t anyone else get sad!”
In Other News:
• The Crustacean Fisheries group, in conjunction with the FWRI Aquatic Health group, is developing a Blue Crab Health Identification Sheet that will be available to the public and posted on the FWRI website. Highlighting easily observable parasite and disease conditions, the ID sheet stemmed from a health assessment of blue crabs in Tampa Bay. Blue crab health protocols also have been developed to respond to reports of diseased blue crabs or blue crab kills statewide.
• Scientists are conducting studies to determine the age of blue crabs. But because blue crabs can vary widely in size at any age, pinpointing their age can be tricky. “A large blue crab is not necessarily an old crab, but may be a young crab with a fast rate of growth,” says McMillen-Jackson. “We’ll be measuring levels of a metabolic by-product, lipofuscin, in wild-caught Tampa Bay blue crabs, and compare them with those from known-age crabs that we rear from hatching. With this information, we can determine the age structure of the Tampa Bay blue crab population.”
 Tarpon may be the poster child for fisheries management.
One of the state’s most coveted gamefish, tarpon were heavily fished across Florida and in Tampa Bay until a bag limit of two fish per day was established in 1953. That was followed in 1989 by a $50 “tag” required to kill a tarpon. Since then, only about 300 tags are issued annually and last year only 27 tag owners across the state reported harvesting a fish.
Tarpon By the Numbers FWRI sonically tagged and tracked 39 tarpon in Tampa Bay from 2005-2007 to evaluate short-term survival from tarpon angling events. Of the 123 tarpon observed being fought from time of hook up to release/escape, 43% were actually landed by anglers. Four that were caught and released by anglers suffered mortality, resulting in an estimated catch-and-release survival rate of 89.74% for Tampa Bay. Top causes of mortality include shark attacks and the inability of tarpon to recover from the stress of being handled. |
That protection has helped tarpon populations in Tampa Bay remain stable in spite of their long-standing popularity but there’s still room for improvement. Up to 11% of tarpon caught and released die within six hours. The most common cause of death is improperly handling the fish.
“Tackle doesn’t seem to be an issue – not hook type, bait or even fight time,” notes Kathy Guindon, the FWRI scientist leading a multi-year study on tarpon mortality in Tampa Bay and Boca Grande. “The only statistically significant difference we could see was hook placement, and that’s not something a fisherman can easily control.”
While a large percentage of tarpon that die after they are caught and released are killed by sharks, the key indicator for whether a fish survives is its condition when released, Guidon said. In some cases, highly active fish are likely to swim away and may be caught by another angler, but inactive, disoriented fish may die on their own or be eaten by sharks.
Handling the fish by its gills is a top reason tarpon die, she said. In some cases, a few extra minutes spent to resuscitate a fish may save its life, particularly if predators are nearby. “We saw a tarpon released on the Hillsborough side of the bay – it sank like a log and stayed at the bottom for 10 minutes – until it recovered and swam off. Luckily there were no predators nearby and we tracked it for the full six hours.”
 Spotted seatrout, says Sue Barbieri, are the canary in the coal mine for coastal ecosystems.
Inshore fish that spend most of their lives in the same estuary where they were born, spotted seatrout require quality habitat and are sensitive to many environmental issues, says Barbieri, a research scientist with FWRI. One of the state’s most sought-after gamefish, spotted seatrout are also one of Tampa Bay’s most important success stories.
“The fact that they could come back after a major event like that red tide is a good indication that they were a healthy population.” — Sue Barbieri |
Highly overfished in the 1980s and early ‘90s when both recreational and commercial fishermen targeted the tasty species, populations began to rebound in the mid-‘90s with tightened seasons, bag limits and size slots for anglers and the passage of the constitutional amendment limiting gill netting in state waters. Those efforts, as well as new regulations in 2000, were so successful that seatrout not only recovered from the historic overfishing but were able to rebound from one of the worst red tides on record in 2005.
A full assessment of the fishery is still pending, but Barbieri said that populations appear to be back at healthy levels in nearly all bay segments even though they were almost wiped out in 2005.
“The fact that they could come back after a major event like that red tide is a good indication that they were a healthy population.”
As the state’s largest and most industrialized estuary, Tampa Bay was selected as the site for an in-depth study on seatrout spawning that began in 2003. Using a variety of tracking methods, including passive acoustic surveys and ultrasonic tagging, Barbieri is leading a team of researchers working to determine where, when and how environmental issues like red tide, habitat destruction, increased fishing pressure and climate change impact seatrout populations.
“Spotted seatrout are what we called a ‘closed population’ and most of these fish spend pretty much their whole lives in Tampa Bay.” — Sue Barbieri |
“Spotted seatrout are what we called a ‘closed population’ and most of these fish spend pretty much their whole lives in Tampa Bay,” she said. A female may lay up to 18 million eggs over a spawning season that runs from March through September, with the older, larger females laying the most eggs. In a good year with high numbers of fish spawning, the larva will be cannibalistic. “They’ll eat anything that’s smaller than they are,” Barbieri quips.
Most seatrout mature in about a year, so they were able to repopulate the bay quickly from small populations remaining after the red tide event. Their rapid recovery reflects the overall health of the bay, but limited populations in bay segments off the heavily populated central Pinellas County and Hillsborough Bay may bode badly for the future.
Seatrout depend upon seagrasses, particularly meadows in the deeper parts of the bay. “It might be stormwater issues,” she said. “Those are the bay segments near a lot of hard surfaces where runoff could be a problem.”